Course Content
Chapter 01 – Operations on Sets
The set operations are performed on two or more sets to obtain a combination of elements as per the operation performed on them. In a set theory, there are three major types of operations performed on sets, such as: Union of sets (∪) The intersection of sets (∩) Difference of sets ( – ) In this lesson we will discuss these operations along with their Venn diagram and will learn to verify the following laws: Commutative, Associative, Distributive, and De-Morgans' law.
0/14
Chapter 02 – Real Numbers
All real numbers follow three main rules: they can be measured, valued, and manipulated. Learn about various types of real numbers, like whole numbers, rational numbers, and irrational numbers, and explore their properties. In this chapter, we will learn about Squares and cubes of real numbers and find their roots.
0/6
Chapter 03 – Number System
The number system or the numeral system is the system of naming or representing numbers. There are different types of number systems in Mathematics like decimal number system, binary number system, octal number system, and hexadecimal number system. In this chapter, we will learn different types and conversion procedures with many number systems.
0/13
Chapter 04 – Financial Arithmetic
Financial mathematics describes the application of mathematics and mathematical modeling to solve financial problems. In this chapter, we will learn about partnership, banking, conversion of currencies, profit/markup, percentage, and income tax.
0/11
Chapter 05 – Polynomials
In algebra, a polynomial equation contains coefficients, exponents, and variables. Learn about forming polynomial equations. In this chapter, we will study the definition and the three restrictions of polynomials, we'll tackle polynomial equations and learn to perform operations on polynomials, and learn to avoid common mistakes.
0/6
Chapter 06 – Factorization, Simultaneous Equations
In algebra, factoring is a technique to simplify an expression by reversing the multiplication process. Simultaneous Equations are a set of two or more algebraic equations that share variables and are solved simultaneously. In this chapter, we will learn about factoring by grouping, review the three steps, explore splitting the middle term, and work examples to practice verification and what simultaneous equations are with examples. Find out how to solve the equations using the methods of elimination, graphing, and substitution.
0/10
Chapter 07 – Fundamentals of Geometry
Geometry is the study of different types of shapes, figures, and sizes. It is important to know and understand some basic concepts. We will learn about some of the most fundamental concepts in geometry, including lines, polygons, and circles.
0/4
Chapter 08 – Practical Geometry
Geometric construction offers the ability to create accurate drawings and models without the use of numbers. In this chapter, we will discover the methods and tools that will aid in solving math problems as well as constructing quadrilaterals and right-angled triangles.
0/3
Chapter 09 – Areas and Volumes
The volume and surface area of a sphere can be calculated when the sphere's radius is given. In this chapter, we will learn about the shape sphere and its radius, and understand how to calculate the volume and surface area of a sphere through some practice problems. Also, we will learn to use and apply Pythagoras' theorem and Herons' formula.
0/7
Chapter 10 – Demonstrative Geometry
Demonstrative geometry is a branch of mathematics that is used to demonstrate the truth of mathematical statements concerning geometric figures. In this chapter, we will learn about theorems on geometry that are proved through logical reasoning.
0/5
Chapter 11 – Trigonometry
Sine and cosine are basic trigonometric functions used to solve the angles and sides of triangles. In this chapter, we will review trigonometry concepts and learn about the mnemonic used for sine, cosine, and tangent functions.
0/7
Chapter 12 – Information Handling
Frequency distribution, in statistics, is a graph or data set organized to show the frequency of occurrence of each possible outcome of a repeatable event observed many times. Measures of central tendency describe how data sets are clustered in a central value. In this chapter, we will learn to construct the frequency distribution table, and learn more about three measures of central tendency, its importance, and various examples.
0/9
Mathematics – VIII
About Lesson

What is a Bar Graph?

A bar graph can be defined as a chart or a graphical representation of data, quantities or numbers using bars or strips. Bar graphs are used to compare and contrast numbers, frequencies or other measures of distinct categories of data.

What is Bar Graph? [Definition Facts & Example]

What is a Bar Graph Used For ?

A bar graph (also known as a bar chart or bar diagram) is a visual tool. A bar graph may run horizontally or vertically. The important thing to know is that the longer the bar, the greater its value. Bar graphs consist of two axes. On a vertical bar graph, as shown above, the horizontal axis (or x-axis) shows the data categories. In this example, they are years. The vertical axis (or y-axis) is the scale. The colored bars are the data series.

Bar graphs have three key attributes:

  • A bar diagram makes it easy to compare sets of data between different groups at a glance.
  • The graph represents categories on one axis and a discrete value in the other. The goal is to show the relationship between the two axes.
  • Bar charts can also show big changes in data over time.

Types of a Bar Graph

When presenting data visually, there are several different styles of bar graphs to consider.

Vertical Bar Graph

The most common type of bar graph is the vertical bar graph. It is very useful when presenting a series of data over time.

Bar Graphs

One disadvantage of vertical bar graphs is that they don’t leave much room at the bottom of the chart if long labels are required.

Horizontal Bar Graph

Converting the vertical data to a horizontal bar chart solves this problem. There is plenty of room for the long label along the vertical axis, as shown below.

Bar Graphs

How to Construct a Bar Graph?

Steps in construction of bar graphs/column graph:

● On a graph, draw two lines perpendicular to each other, intersecting at 0.

● The horizontal line is x-axis and vertical line is y-axis.

● Along the horizontal axis, choose the uniform width of bars and uniform gap between the bars and write the names of the data items whose values are to be marked.

● Along the vertical axis, choose a suitable scale in order to determine the heights of the bars for the given values. (Frequency is taken along y-axis).

● Calculate the heights of the bars according to the scale chosen and draw the bars.

Examples:

1. The percentage of total income spent under various heads by a family is given below.

Different Heads Food Clothing Health Education House Rent Miscellaneous
% Age of Total
Number
40% 10% 10% 15% 20% 5%

Represent the above data in the form of bar graph.
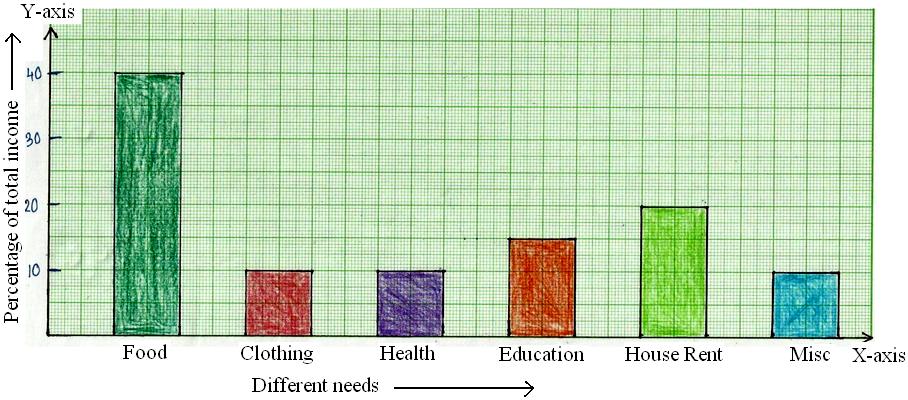
Examples on Construction of Bar Graphs

2. 150 students of class VI have popular school subjects as given below:

Subject French English Maths Geography Science
Number of Students 30 20 26 38 34

Draw the column graph/bar graph representing the above data.

Solution:

Take the subjects along x-axis, and the number of students along y-axis

Bar Graph Representation

Bar graph gives the information of favorite subjects of 150 students.

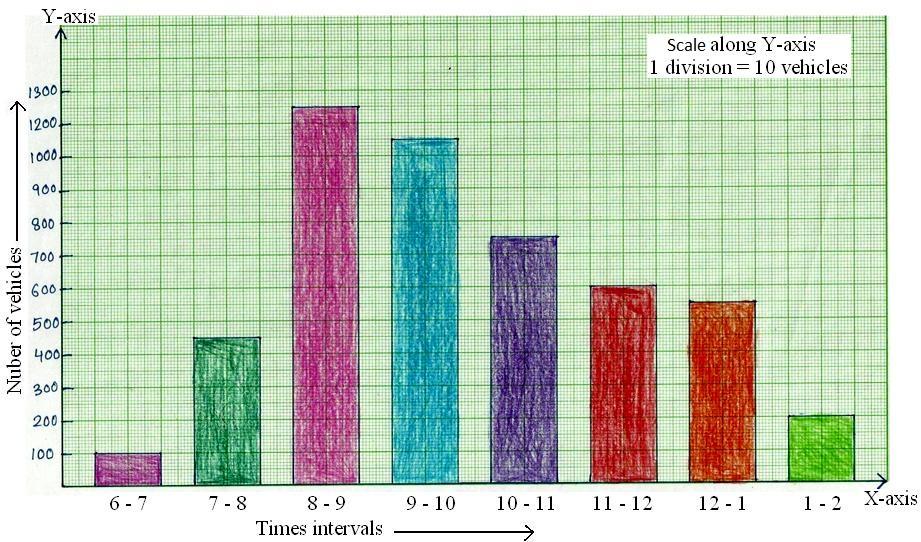
3. The vehicular traffic at a busy road crossing in a particular place was recorded on a particular day from 6 am to 2 pm and the data was rounded off to the nearest tens.

Time in Hours 6 – 7 7 – 8 8 – 9 9 – 10 10 – 11 11 – 12 12 – 1 1 – 2
Number of Vehicles 100 450 1250 1050 750 600 550 200

Bar Graph or Column Graph

Bar graph gives the information of number of vehicles passing through the crossing during different intervals of time.

Exercise Files
Bar-charts.pdf
Size: 264.25 KB
Bar Graphs.pdf
Size: 121.13 KB
0% Complete