Course Content
Chapter 01 – Operations on Sets
The set operations are performed on two or more sets to obtain a combination of elements as per the operation performed on them. In a set theory, there are three major types of operations performed on sets, such as: Union of sets (∪) The intersection of sets (∩) Difference of sets ( – ) In this lesson we will discuss these operations along with their Venn diagram and will learn to verify the following laws: Commutative, Associative, Distributive, and De-Morgans' law.
0/14
Chapter 02 – Real Numbers
All real numbers follow three main rules: they can be measured, valued, and manipulated. Learn about various types of real numbers, like whole numbers, rational numbers, and irrational numbers, and explore their properties. In this chapter, we will learn about Squares and cubes of real numbers and find their roots.
0/6
Chapter 03 – Number System
The number system or the numeral system is the system of naming or representing numbers. There are different types of number systems in Mathematics like decimal number system, binary number system, octal number system, and hexadecimal number system. In this chapter, we will learn different types and conversion procedures with many number systems.
0/13
Chapter 04 – Financial Arithmetic
Financial mathematics describes the application of mathematics and mathematical modeling to solve financial problems. In this chapter, we will learn about partnership, banking, conversion of currencies, profit/markup, percentage, and income tax.
0/11
Chapter 05 – Polynomials
In algebra, a polynomial equation contains coefficients, exponents, and variables. Learn about forming polynomial equations. In this chapter, we will study the definition and the three restrictions of polynomials, we'll tackle polynomial equations and learn to perform operations on polynomials, and learn to avoid common mistakes.
0/6
Chapter 06 – Factorization, Simultaneous Equations
In algebra, factoring is a technique to simplify an expression by reversing the multiplication process. Simultaneous Equations are a set of two or more algebraic equations that share variables and are solved simultaneously. In this chapter, we will learn about factoring by grouping, review the three steps, explore splitting the middle term, and work examples to practice verification and what simultaneous equations are with examples. Find out how to solve the equations using the methods of elimination, graphing, and substitution.
0/10
Chapter 07 – Fundamentals of Geometry
Geometry is the study of different types of shapes, figures, and sizes. It is important to know and understand some basic concepts. We will learn about some of the most fundamental concepts in geometry, including lines, polygons, and circles.
0/4
Chapter 08 – Practical Geometry
Geometric construction offers the ability to create accurate drawings and models without the use of numbers. In this chapter, we will discover the methods and tools that will aid in solving math problems as well as constructing quadrilaterals and right-angled triangles.
0/3
Chapter 09 – Areas and Volumes
The volume and surface area of a sphere can be calculated when the sphere's radius is given. In this chapter, we will learn about the shape sphere and its radius, and understand how to calculate the volume and surface area of a sphere through some practice problems. Also, we will learn to use and apply Pythagoras' theorem and Herons' formula.
0/7
Chapter 10 – Demonstrative Geometry
Demonstrative geometry is a branch of mathematics that is used to demonstrate the truth of mathematical statements concerning geometric figures. In this chapter, we will learn about theorems on geometry that are proved through logical reasoning.
0/5
Chapter 11 – Trigonometry
Sine and cosine are basic trigonometric functions used to solve the angles and sides of triangles. In this chapter, we will review trigonometry concepts and learn about the mnemonic used for sine, cosine, and tangent functions.
0/7
Chapter 12 – Information Handling
Frequency distribution, in statistics, is a graph or data set organized to show the frequency of occurrence of each possible outcome of a repeatable event observed many times. Measures of central tendency describe how data sets are clustered in a central value. In this chapter, we will learn to construct the frequency distribution table, and learn more about three measures of central tendency, its importance, and various examples.
0/9
Mathematics – VIII
About Lesson

What is Central Tendency?

Central tendency is a descriptive summary of a dataset through a single value that reflects the center of the data distribution. Along with the variability (dispersion) of a dataset, central tendency is a branch of descriptive statistics.

The central tendency is one of the most quintessential concepts in statistics. Although it does not provide information regarding the individual values in the dataset, it delivers a comprehensive summary of the whole dataset.

Various measures of central tendency - Formula, Solved Example Problems

Measures of Central Tendency

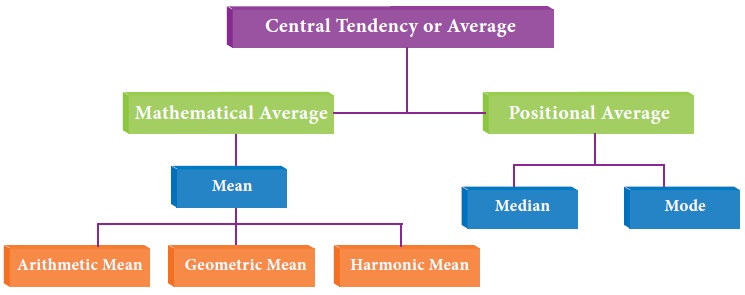
Generally, the central tendency of a dataset can be described using the following measures:

  • Mean (Average):  Represents the sum of all values in a dataset divided by the total number of the values.

  • Median:  The middle value in a dataset that is arranged in ascending order (from the smallest value to the largest value). If a dataset contains an even number of values, the median of the dataset is the mean of the two middle values.

  • Mode: Defines the most frequently occurring value in a dataset. In some cases, a dataset may contain multiple modes, while some datasets may not have any mode at all.


The selection of a central tendency measure depends on the properties of a dataset. For instance, the mode is the only central tendency measure for categorical data, while a median works best with ordinal data.

Although the mean is regarded as the best measure of central tendency for quantitative data, that is not always the case. For example, the mean may not work well with quantitative datasets that contain extremely large or extremely small values. The extreme values may distort the mean. Thus, you may consider other measures.

The measures of central tendency can be found using a formula or definition. Also, they can be identified using a frequency distribution graph. 

Exercise Files
Practice Measures od Central Tendency.pdf
Size: 302.11 KB
0% Complete