What is a Pie Chart?
A pie chart is a graphical representation technique that displays data in a circular-shaped graph. It is a composite static chart that works best with few variables. Pie charts are often used to represent sample data—with data points belonging to a combination of different categories. Each of these categories is represented as a “slice of the pie.” The size of each slice is directly proportional to the number of data points that belong to a particular category.

Formula
The pie chart is an important type of data representation. It contains different segments and sectors in which each segment and sector of a pie chart forms a specific portion of the total(percentage). The sum of all the data is equal to 360°.
The total value of the pie is always 100%.
To work out with the percentage for a pie chart, follow the steps given below:
- Categorize the data
- Calculate the total
- Divide the categories
- Convert into percentages
- Finally, calculate the degrees
Therefore, the pie chart formula is given as
(Given Data/Total value of Data) × 360°
Note: It is not mandatory to convert the given data into percentages until it is specified. We can directly calculate the degrees for given data values and draw the pie chart accordingly.
Example: Student Grades
Here is how many students got each grade in the recent test:
| A | B | C | D |
| 4 | 12 | 10 | 2 |
And here is the pie chart:

A pie chart can be used to represent the relative size of a variety of data such as:
- The type of houses (1bhk, 2bhk, 3bhk, etc.) people have
- Types of 2 wheelers or 4 wheelers people have
- Number of customers a retail market has in all weekdays
- Weights of students in a class
- Types of cuisine liked by different people in an event
- Monthly expenditure of a family, etc.
Uses of Pie Chart
- Within a business, it is used to compare areas of growth, such as turnover, profit and exposure.
- To represent categorical data.
- To show the performance of a student in a test, etc.
When Not to Use Pie Charts?
- Don’t Use Pie Chart to Represent Incompatible Data
A pie chart is useful to represent data that is a part of a whole. As you can see in the above examples, the categories such as furniture, electronics, toys, and groceries are parts of wholesale data and add up to 100 percent. A pie chart does not make sense if it represents disjointed data and isn’t part of a whole data set.
- Don’t Use Pie Charts for Data Comparison
It is not a good idea to compare two pie charts for understanding the change in data over time. It is not easy to compare two pie charts slice by slice, and it’s often difficult to derive insights from such a comparison.
- Don’t use Pie Charts for Comparison Between Slices
While the pie chart gives a good idea of how different categories in the sample data contribute to a whole, it is not an excellent way to compare the slices. Comparing the size of the slices may not give a good sense of the difference between them. It might work if one slice is much bigger than the other, but the comparison based on slice-size may not work for numbers that are too close to one another.
How to Solve Pie Chart Questions?
In this section, you will learn how to solve or interpret the pie chart to get the original values. For this, we need to check whether the given chart is given in percentages, degrees or without any value. Based on this information, we can solve the questions related to pie charts. Let’s have a look at the solved example to understand this thoroughly
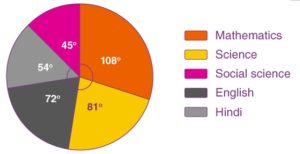
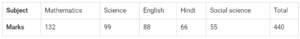
Question: The pie-chart shows the marks obtained by a student in an examination. If the student secures 440 marks in all, calculate the marks in each of the given subjects.
Solution:
The given pie chart shows the marks obtained in the form of degrees.
Given, total marks obtained = 440
i.e. 360 degrees = 440 marks
Now, we can calculate the marks obtained in each subject as follows.
Marks secured in mathematics = (central angle of maths/ 360°) × Total score secured
= (108°/ 360°) × 440 = 132 marks
Marks secured in science = (central angle of science / 360°) × Total score secured
= (81°/ 360°) × 440 = 99 marks
Marks secured in English = (central angle of English/ 360°) × Total score secured
= (72°/ 360°) × 440 = 88 marks
Marks secured in Hindi = (central angle of Hindi / 360°) × Total score secured
= (54°/ 360°) × 440 = 66 marks
Marks secured in social science = (central angle of social science / 360°) × Total score secured
= (45°/ 360°) × 440 = 55 marks
This can be tabulated as:
Advantages
- The picture is simple and easy-to-understand.
- Data can be represented visually as a fractional part of a whole.
- It helps in providing an effective communication tool for the even uninformed audience.
- Provides a data comparison for the audience at a glance to give an immediate analysis or to quickly understand information.
- No need for readers to examine or measure underlying numbers themselves, which can be removed by using this chart.
- To emphasize a few points you want to make, you can manipulate pieces of data in the pie chart.
Disadvantages
- It becomes less effective if there are too many pieces of data to use.
- If there are too many pieces of data. Even if you add data labels and numbers may not help here, they themselves may become crowded and hard to read.
- As this chart only represents one data set, you need a series to compare multiple sets.
- This may make it more difficult for readers when it comes to analyze and assimilate information quickly.